Is Brent Now the Global Benchmark for Crude Oil Hedging?
In early December the EIA announced that beginning with its 2013 Annual Energy Outlook, which will be published in the spring, the agency is going to begin utilizing Brent crude oil, rather than WTI, as its "reference" crude oil price.
According to the EIA, "The oil price is represented by spot prices for light, sweet Intercontinental Exchange Brent crude oil instead of WTI crude oil traded on NYMEX. This change was made to better reflect the price refineries pay for imported light, sweet crude oil and takes into account the divergence of WTI prices from those of globally traded benchmark crudes such as Brent. WTI prices have diverged from other benchmark crude prices because of insufficient pipeline capacity to move crude oil to and from Cushing, Oklahoma (the location at which WTI prices are quoted), and the growth of midcontinent and Canadian oil production that has overwhelmed the transportation infrastructure needed to move crude from Cushing to the U.S. Gulf of Mexico."
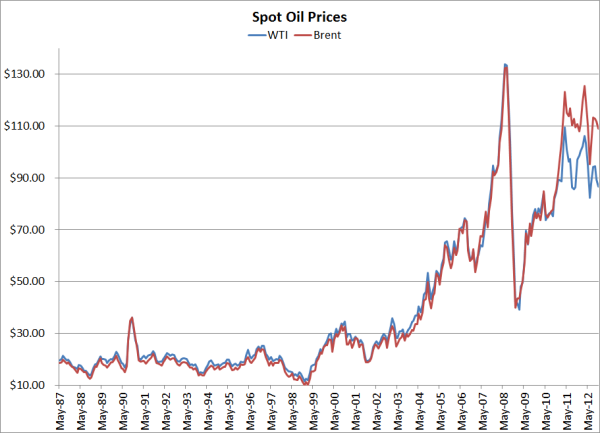
While the CME (NYMEX) has done its best to defend WTI futures as "the global benchmark" (see WTI: Understanding the Global Crude Oil Benchmark) times have indeed changed, as indicated in the following chart. From 1987 (when the EIA began collecting cash market data on both WTI and Brent) through 2010, WTI was indeed the global benchmark, trading at an average of $1.37/BBL over Brent. However, since the beginning of 2011 the tide has turned, with Brent trading at an average of $16.76 over WTI, peaking last month $22.53.

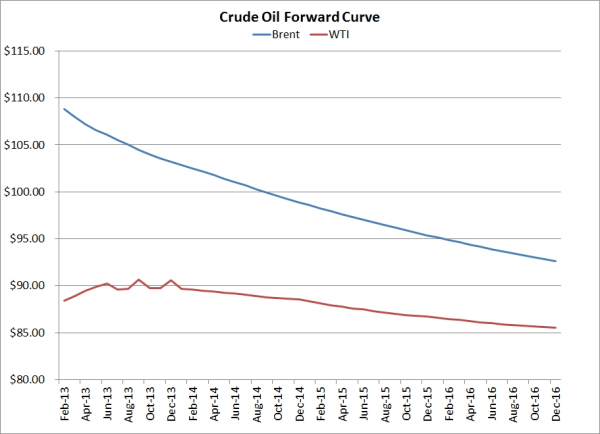
In addition, to the significant change in the spot price spread, the shape of the forward curves is quite different as well as Brent is in a state of deep backwardation though 2016 while WTI is in a mild state of contango though 2013, followed by a mild state of backwardation though 2016. In numerical terms, February '13 Brent is currently trading near $108.85 while December '16 Brent is at $92.62, a delta of approximately $16/BBL. On the contrary, February '13 WTI is currently trading at $88.40 while December '16 WTI is trading at $85.52, a delta of less than $3/BBL.

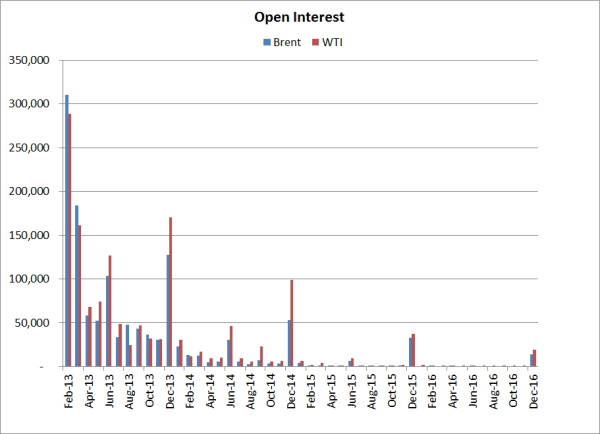
While neither the spread between spot prices nor the shape of the forward curves alone provide us with a good indication as to what will be the dominant crude oil market in the future, there is one variable that can help us better understand the bigger picture, open interest.
In layman's terms, open interest is simply the current number of outstanding futures contracts. As the following graph indicates, the open interest in prompt month (February '13) Brent futures is stronger than than the open interest in WTI futures but when we look at the forward curve through 2016,in 77% of those months, the open interest in WTI is stronger than the open interest in Brent . Furthermore, through December '16, the total open interest in WTI (~1.43MM) exceeds the total open interest in Brent (~1.254MM) by ~175,000 contracts.

So is Brent now the global benchmark for crude oil hedging? Unfortunately it's difficult to make any sound conclusions at the present time. While the global interest in Brent is certainly growing (and with due cause as noted by the EIA among hundreds of others), it's obviously way too early to say that WTI is dying a slow death. That being said, as we have long advocated, so long as both markets offer sufficient liquidity (which they do), you should be hedging with the product that has the strongest correlation to your actual price risk, regardless of whether it is Brent or WTI. And for many the product won't be Brent or WTI but the product you actually consume, process or produce i.e. bunker fuel, diesel fuel, jet fuel, etc. Lastly, the ongoing changes in the spreads, not just between Brent and WTI, but the refined products as well, may mean that in order to maintain strongly correlated hedges, you will need to shift from one product to another, which certainly isn't ideal but is definitely preferable to hedging with a product that doesn't provide the strongest correlation to your actual price risk.
